Track every KPI your revenue manager cares about — pickup, pace, lead-time distribution, source mix and forward-looking forecasts. Export any chart to PDF or CSV.
RevPAR, ADR, occupancy, forecast.
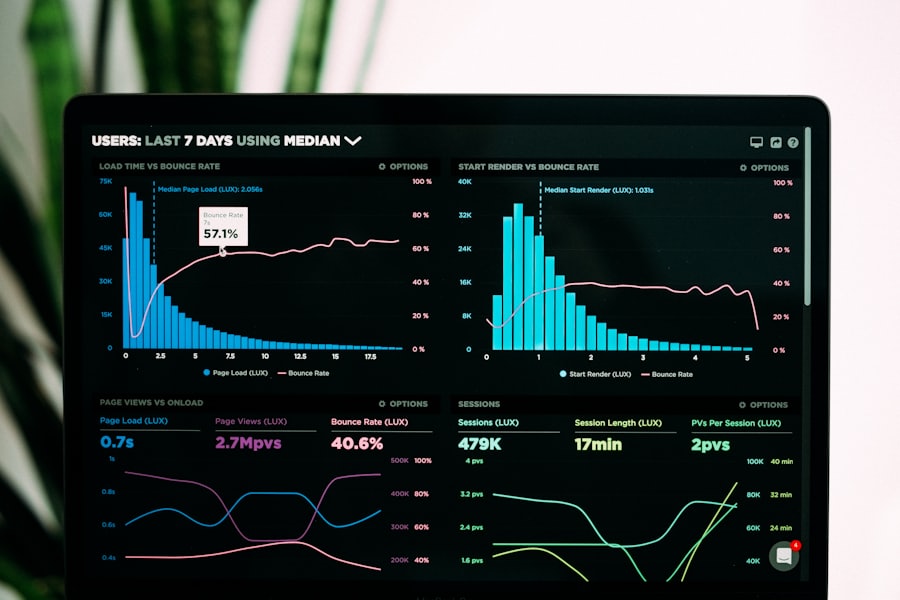
What is included
- RevPAR, ADR, occupancy dashboard
- Pace vs same-time-last-year
- Segmented pickup reports
- 12-month forward forecast
- Competitor benchmarks
How the Revenue Analytics module works day to day
Revenue Analytics is the module your revenue manager will live in. It is designed around one question: how does today compare to what we expected, and what does that mean for the next twelve months of production?
The core dashboard shows RevPAR, ADR and occupancy for today, month-to-date and year-to-date, always compared against same-time-last-year and against your own forecast. Every KPI is decomposed on click — RevPAR breaks into occupancy versus rate, occupancy breaks into pickup versus pace, and pickup breaks into segment mix.
The forward view runs twelve months ahead. Sabee combines historic pickup curves with your current on-the-books position to produce a forecast that stops being wishful thinking. Sensitivity analysis lets you ask what would happen if a specific segment underdelivers by 15% or if the OTA mix shifts toward a channel with a different average booking window.
Segmented pickup reports break the incoming reservation flow by source (each OTA, direct, corporate, wholesale, tour operator), by rate category and by cancellation policy. If a specific segment is drying up, you see it here first — usually a week before it shows in the daily flash report.
Competitor benchmarks compare your ADR and occupancy against an anonymous set of hotels of similar type, size and location. Data is contributed by Sabee customers and aggregated so no individual property is ever identifiable, but the reference points are precise enough to spot pricing gaps.
Every chart exports to PDF for board packs and to CSV for the CFO's spreadsheet. The API also allows headless export into your BI tool of choice for the customers who already have a data warehouse.
Sabee's revenue analytics finally got our team out of the spreadsheet layer we had built over ten years — everything is one source of truth.
— a Sabee customer, 42-room boutique hotel
Included on every plan
The Revenue Analytics module is part of the core Sabee platform — every paid plan includes it, from Solo at €29 per month up to Enterprise. There are no per-user fees, no per-transaction surcharges, and no separate module licences to renew.
See the full plan comparison on the pricing page, or explore the seven other modules on the product overview.
Try the whole platform, not just this module.
Every paid Sabee plan includes all eight modules from day one. Start onboarding access and see how they work together.